在成交和報價表頁, 除了成交價, 成價量欄外, 還會顯示 買入(BID)價, 賣出價(ASK)欄. 當一筆成交的成交價 ≦ 買入價時, 該筆成交的成交量便歸類為即主動沽盤。 如那筆成交的成交價 ≧ 沽出(ASK)買入價, 那筆成交量便歸類為即買盤.
即買盤代表買家心急, 不想用買入價(BID)在市場排隊, 要立刻成交, 所以用較高的ASK價落盤.
即沽盤代表賣家心急, 不想用賣出價(ASK)在市場排隊, 要立刻成交, 所以用較低的BID價落盤.
在一段時間內, 如買盤量>沽盤量, 代表後市向上機會大些, 反之則向下機會大些. 將由第一筆成交的 [買盤量 – 沽盤量] 加起來畫成粉紅色線便成為個有用的指標.
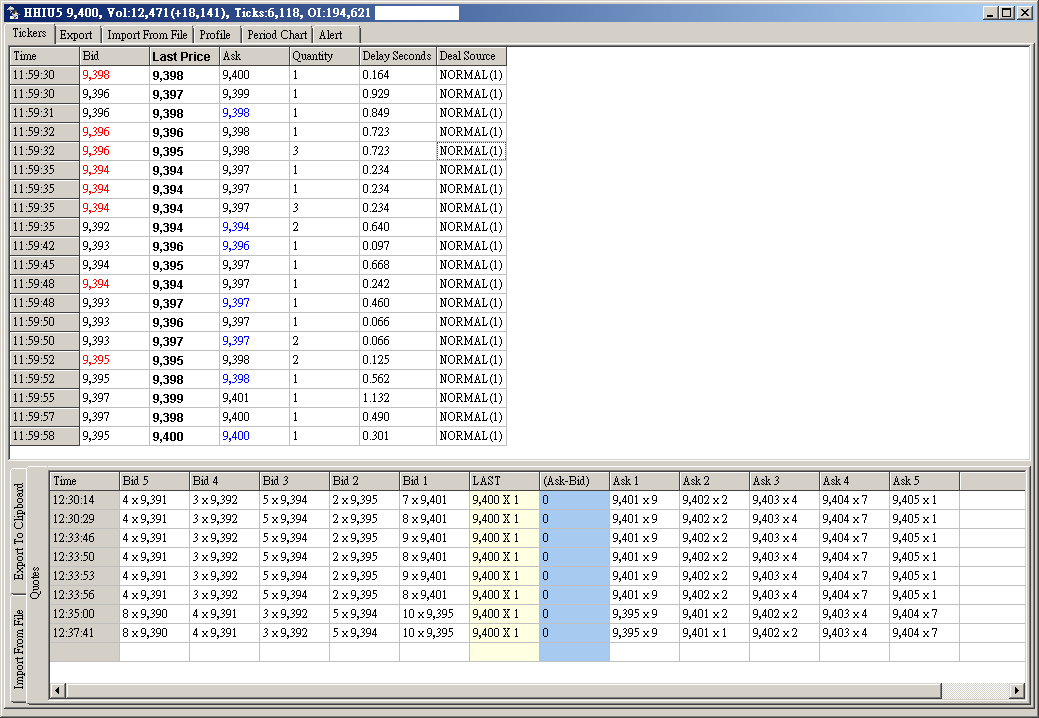
The Blue price in the above table indicates the trade is ACTIVE BOUGHT TRADE.
The Red price in the above table indicates the trade is ACTIVE SOLD TRADE.
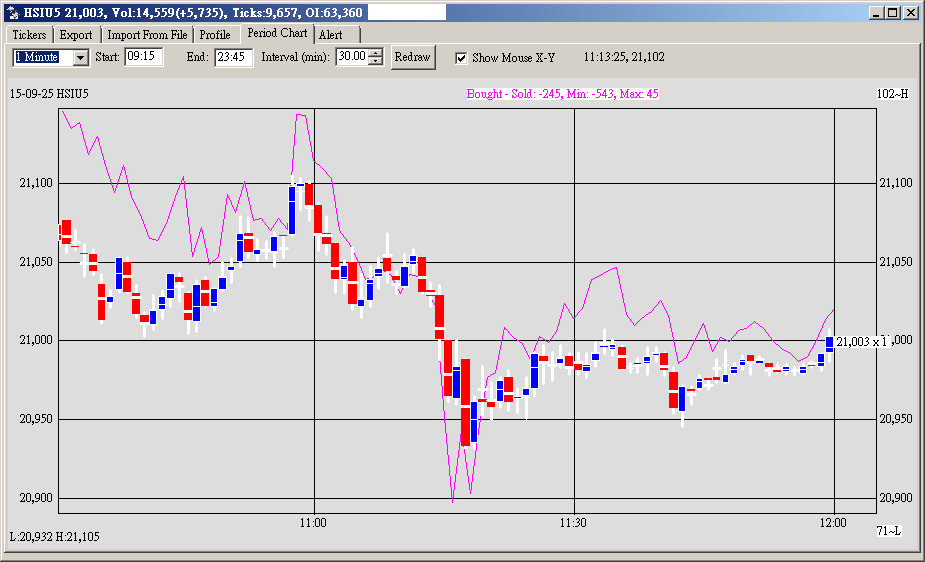
Note: The pink line moves along with the HSIU5 prices.
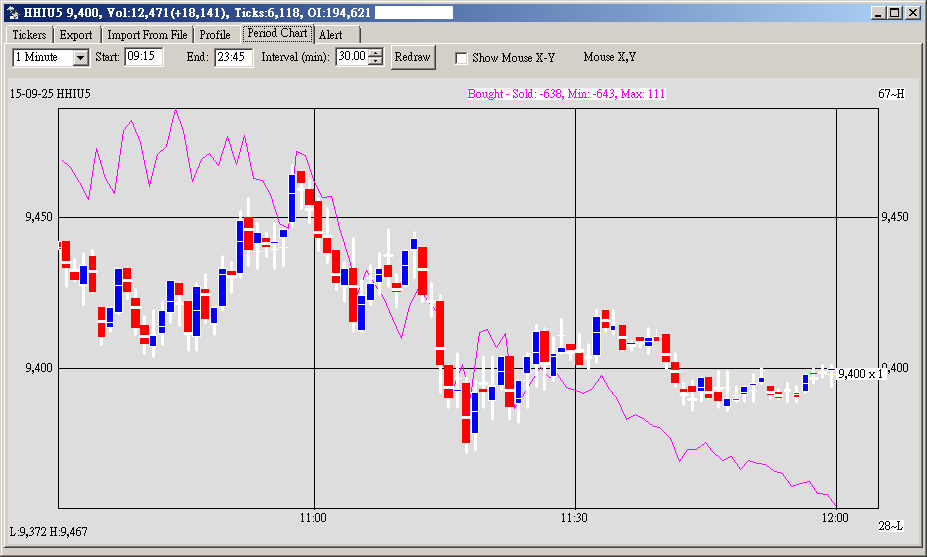
Note: Unlike, the HSIU5, the pink line of HHIU5 does not moves with the HHIU5 prices. That indicates today, the HSIU5 market is controlling the market.
Somedays, HHIU5 controls the market instead.
The pink line gives you more information.
See next feature: Market Profile Chart
如欲免費試用, 請寄 電郵 給我們 或 whatsapp 3502 1457 或加我們LINE.
Line ID : spark-spapi